![]() November 1999
November 1999
Graphs for North American 28 MHz beacons as monitored in the UK. Data for November 1999 compiled from reports by members of the Six and Ten Reporting Club. See below for an explanation of these graphs. For comparison see beacon graphs for North American beacons in December 1998. Also check out the tables showing average reliability of North American beacons in the UK over recent months.
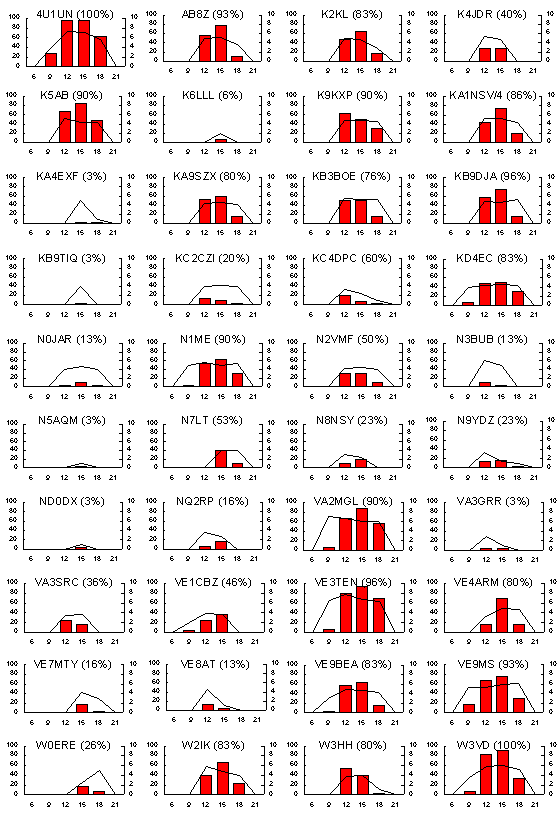
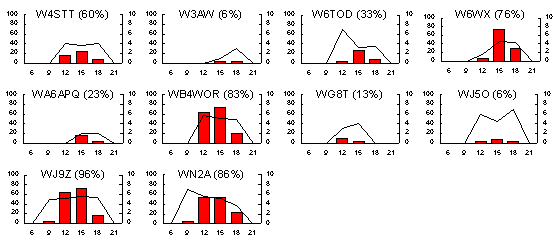
Beacon graphs legend: Graph bars (in red; left side Y-axis): beacon reliability as the percentage of days a beacon was heard by any (UK) observer within each time band. Graph lines (right side Y-axis): signal strength calculated as the average of the daily maximum signal reported by any observer in each time band. Time band codes (X-axis): 6=0600-0900, 9=0900-1200, 12=1200-1500, etc. Times in UT (GMT). Titles are beacon callsigns followed by the daily reliability figures, the percentage of days for the month on which the beacon was reported.